Conversion Dashboard — Early conversion analytics dashboard for Crobox
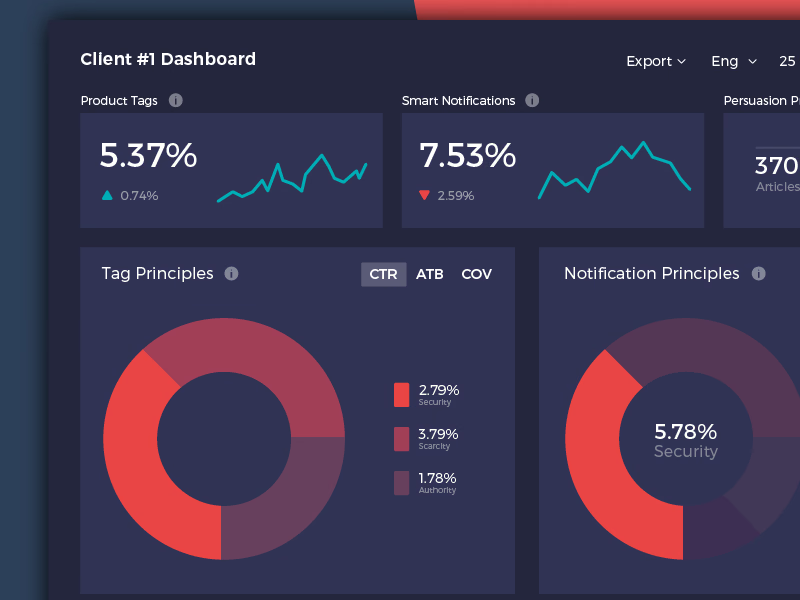
Our first version of the Crobox dashboard, from when we were just starting out. Some elements are outdated, since the product’s structure changed a lot afterward.
Client #1 Dashboard opens with headline cards for product tags and smart notifications, each with a rate, its change and a sparkline. Below, donut charts break results down by persuasion principle, such as security, scarcity and authority, with a CTR, ATB and COV switch on the tag principles. The dark navy and red palette is where we played most with color.
Got something real to build?
Tell us what you’re building and let’s see if we’re a good fit.