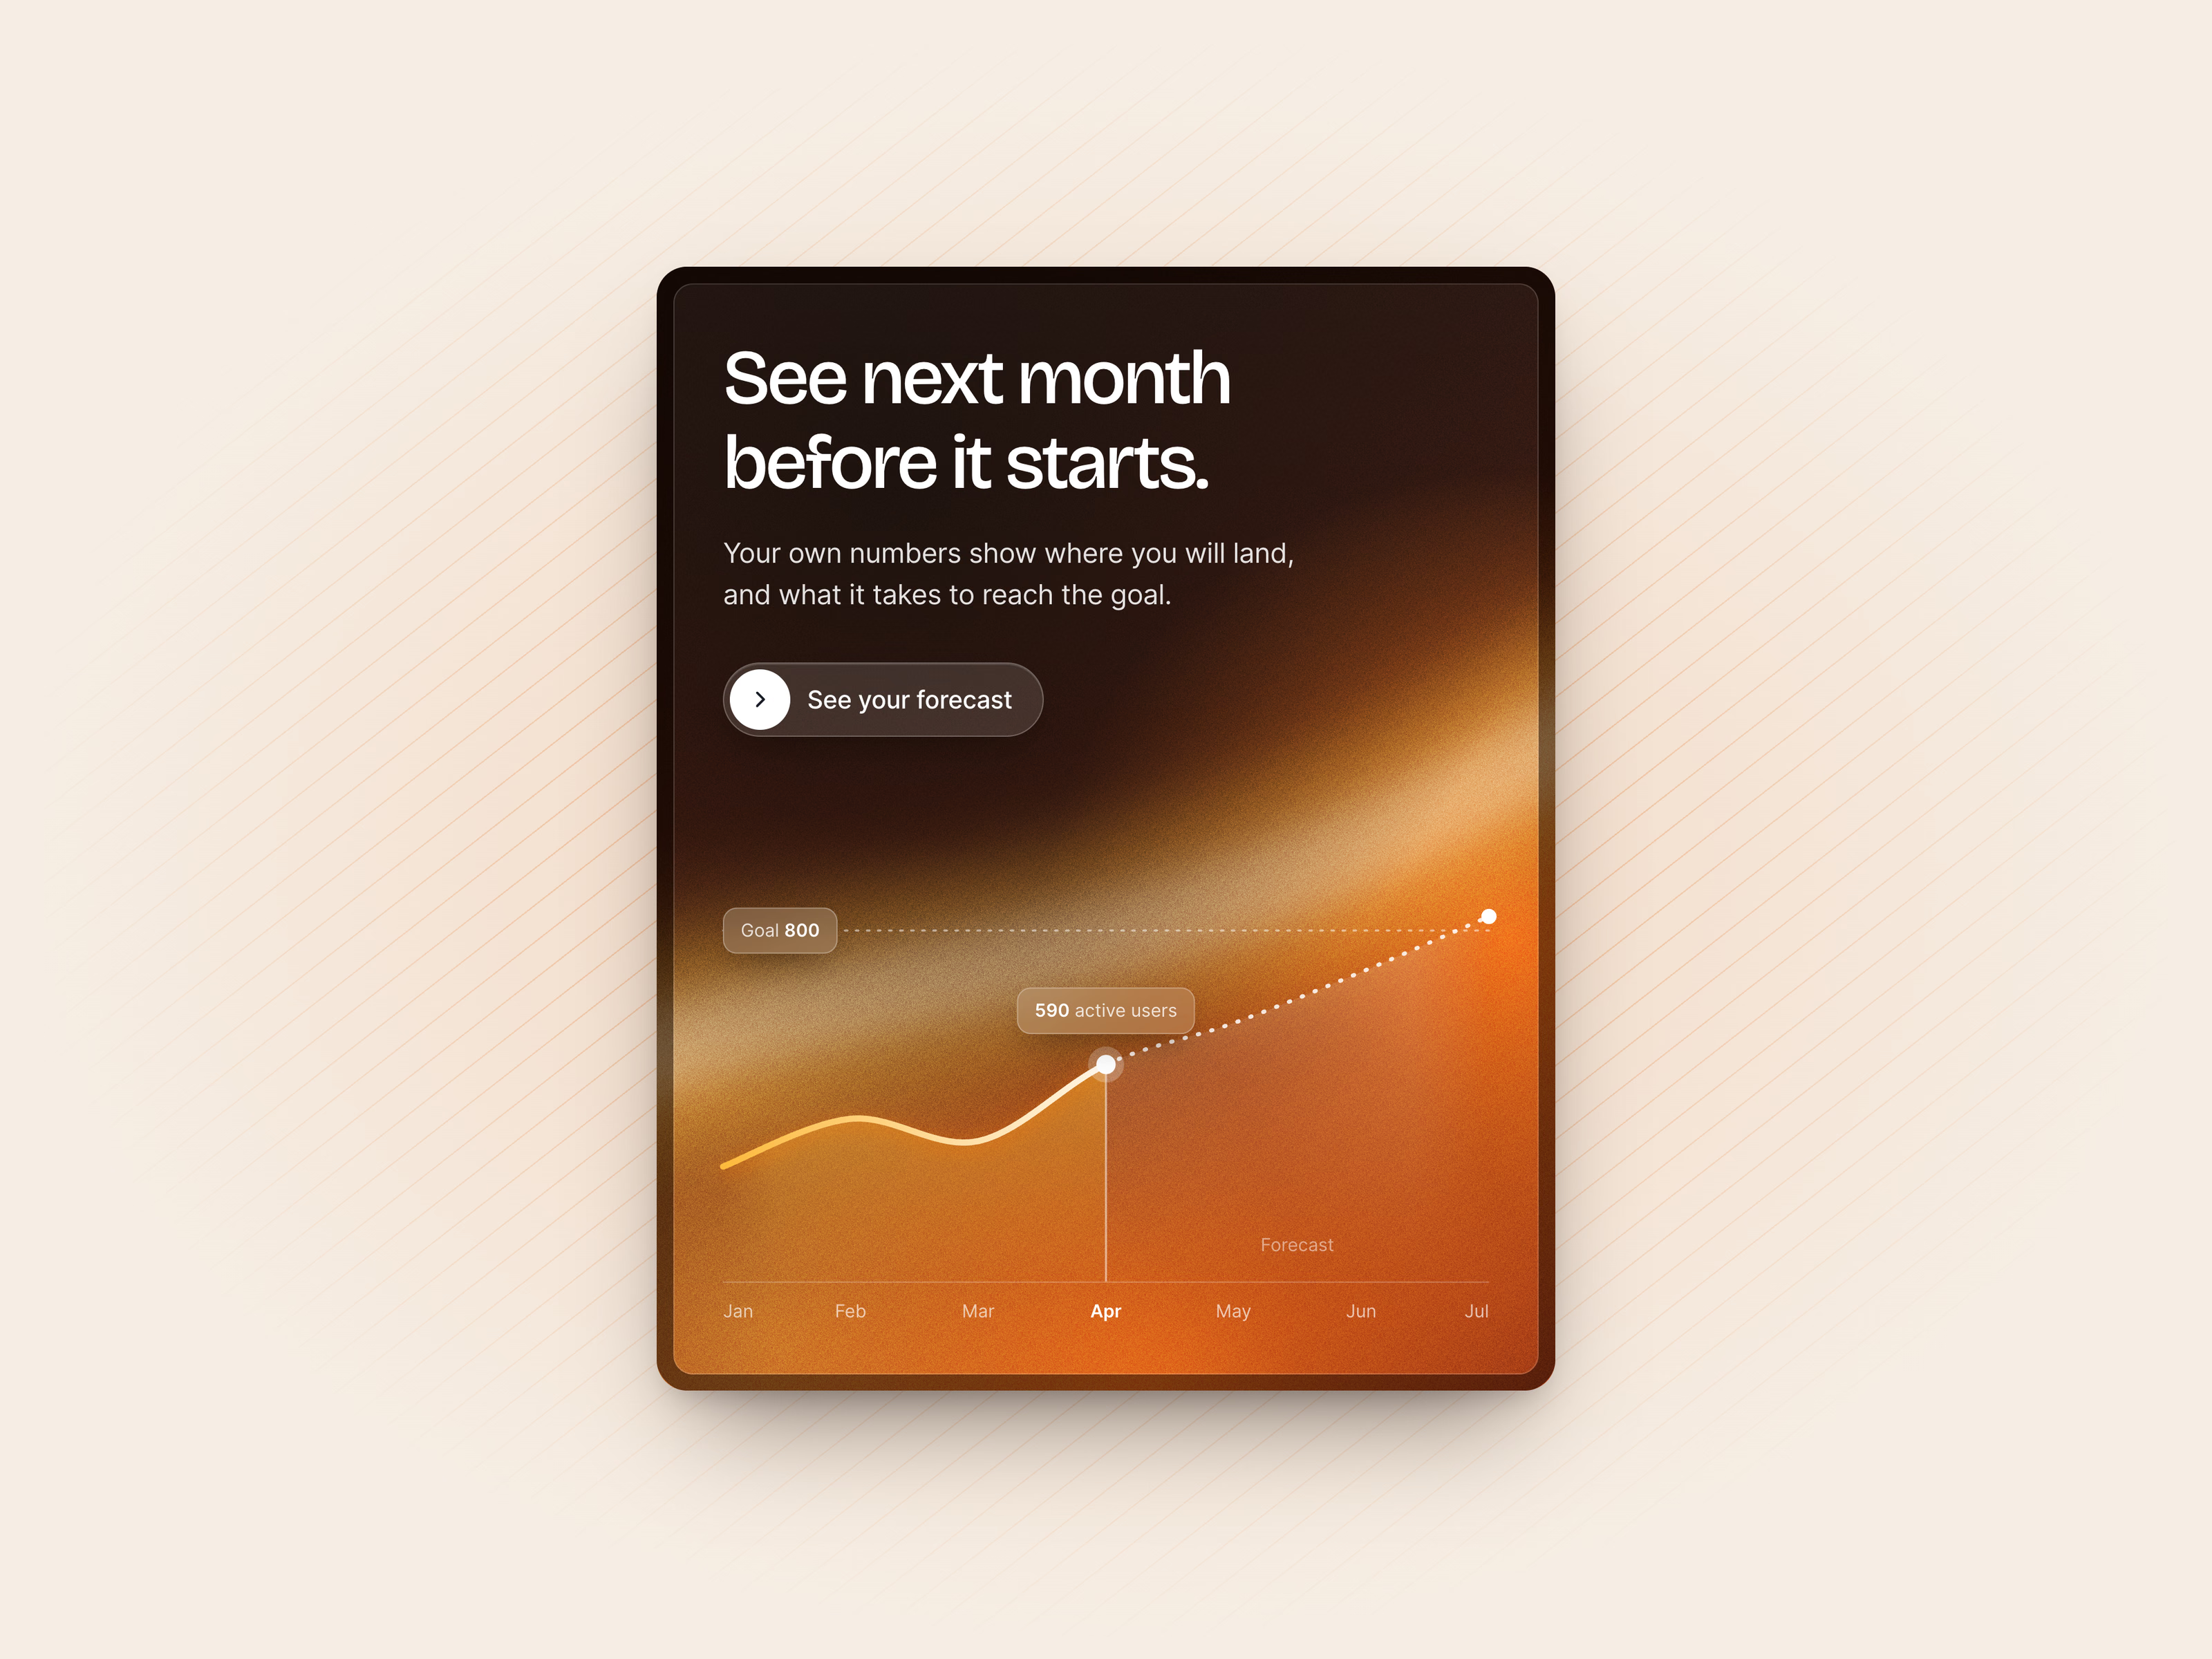
Forecast card — Animated forecast line chart on a dark gradient card
Data can be beautiful if you know how to show it in a beautiful manner and tell a story. We really love to tell a story with the data.
Here the line shows real numbers up to today, and the dotted part after it is the forecast, which runs on toward the goal of 800. There is also a longer cut where the forecast splits into its three plans. Next in the set is the revenue growth card.
Got something real to build?
Tell us what you’re building and let’s see if we’re a good fit.